New Trailforks Map Layers
The latest release of the Trailforks App introduces some brand new features and map layers to help you better plan rides and extended adventures. With this update, we want to take the time to highlight three new map layers to give you more information about how to use them effectively in the app.
Jumps Heat
![photo]()
Elevation Colors
![photo]()
Slope Angle
![photo]()
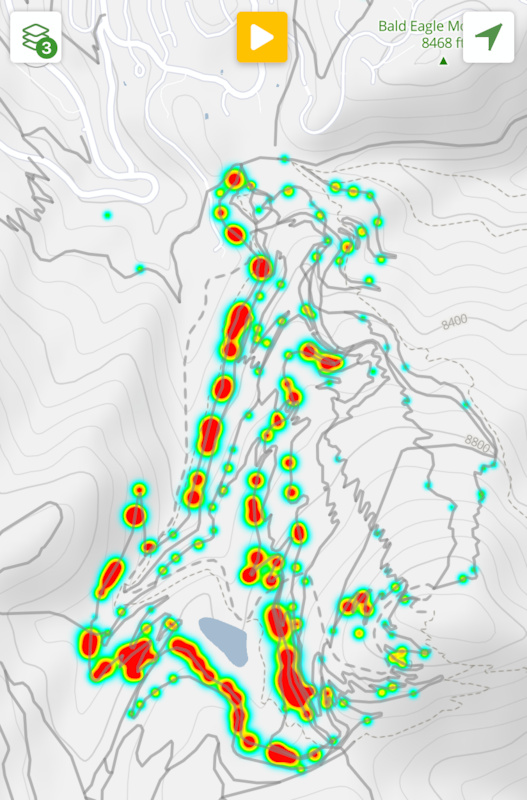
Jumps Heat
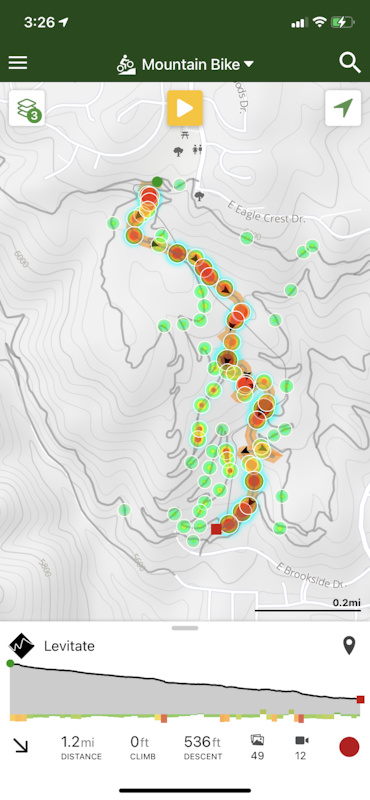
This new interactive layer provides a way to see where riders are jumping their bikes all over the world. The Jumps Heat layer does more then just show where jumps are located, but glows hotter as the jumps are bigger. To do this we take the magnitude of the jump into account, and even limit the heat when jumps are smaller. So it is more then just a jump heatmap, it is a Jump Magnitude heatmap where you can pan around and find which trails have the highest density of big jumps.
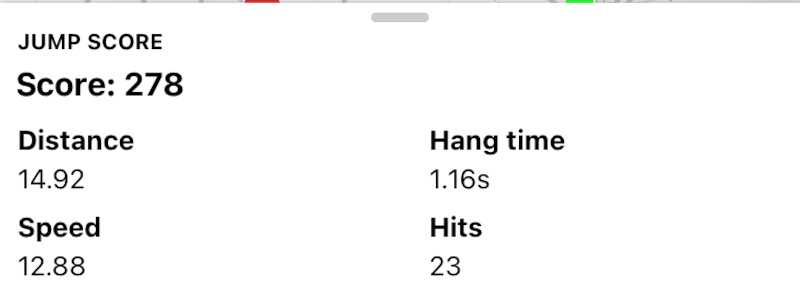
The magnitude is calculated based upon a score that uses hang-time, distance and speed as part of the equation. If you travel to new biking destinations, and you like to jump your bike, you can use this feature to find jumplines where you may not expect them. Not only can you find trails with big jumps, but you can compare average jump scores to your favorite local jump line. Thus providing a relative comparison and some indication as to what you might expect.
The magnitude is calculated based upon a score that uses hang-time, distance and speed as part of the equation. If you travel to new biking destinations, and you like to jump your bike, you can use this feature to find jumplines where you may not expect them. Not only can you find trails with big jumps, but you can compare average jump scores to your favorite local jump line. Thus providing a relative comparison and some indication as to what you might expect.
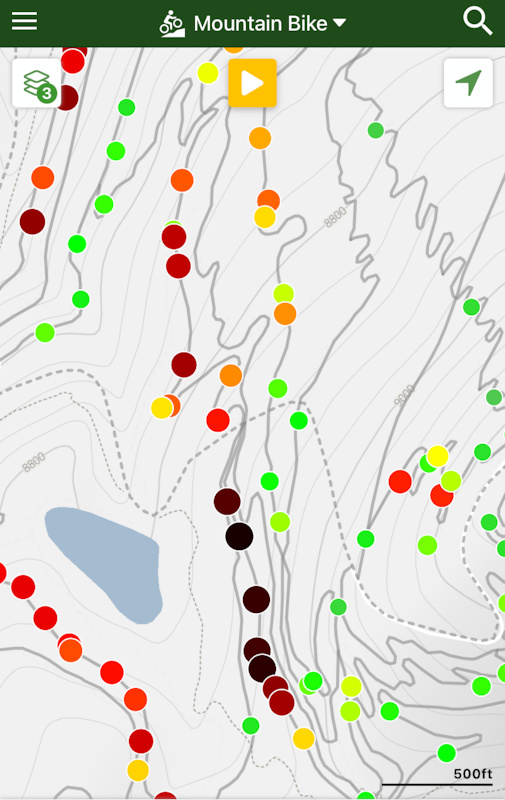
Within the app you can zoom down to see each individual jump and select it to find more information. Each jump uses proximity detection to determine where a specific jump location is by averaging jump recordings within 2 meters. By selecting a detected jump you can see the jumps average score, distance, speed and hang-time. Each specific jump will be color coded by how large the score is. Most jump trails have lots of varying size jumps and the heat layer will show you which ones are the biggest.
![photo]()
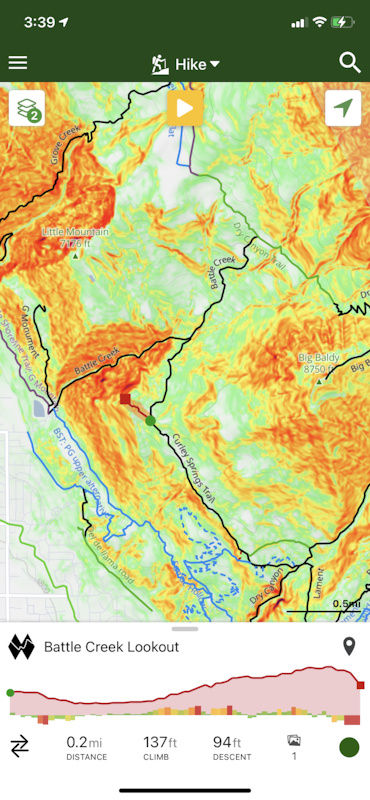
Elevation Colors
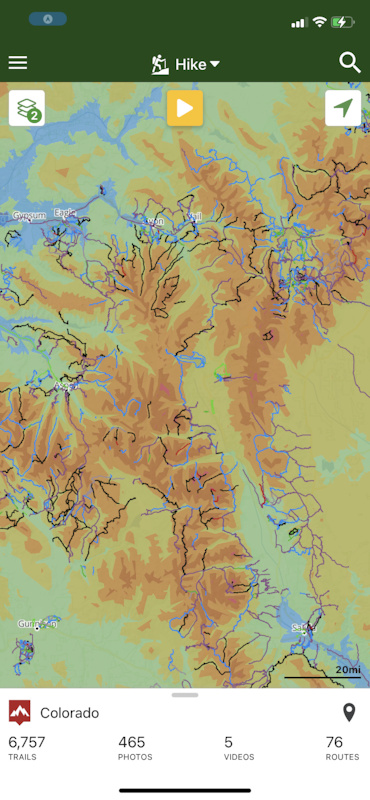
Topographic maps provide a great way to see elevation change along a trail using elevation contour lines. When planning a trip or just a long ride, it is not always easy to visualize relative altitude. With elevation contour lines alone, comparing different trail options that are close together it's not always easy to see which ascends higher (or lower), depending on the adventure you seek (or try to avoid).
Now, using our "Elevation Color" layer, major elevation zones are colored in large blocks (1500ft or 500m). This enables app users the ability to compare their local mountains elevations relative to a travel destination, or perhaps help in finding a new high mountain adventure.
When reviewing a route, mountain passes are easily visualized and their altitude can be quickly assessed. For those travelling from lower altitudes to the high mountains, you may need to adjust your trip to adapt to altitude changes and avoid altitude sickness. You can do this by calculating the difference in elevation that you can tolerate, match the color, and avoid elevations in that zone and above. Even those living at a high altitude can use this feature to plan for thinner air and less tree cover.
We also just think it is cool to see how big some mountains are on our planet.
Slope Angle
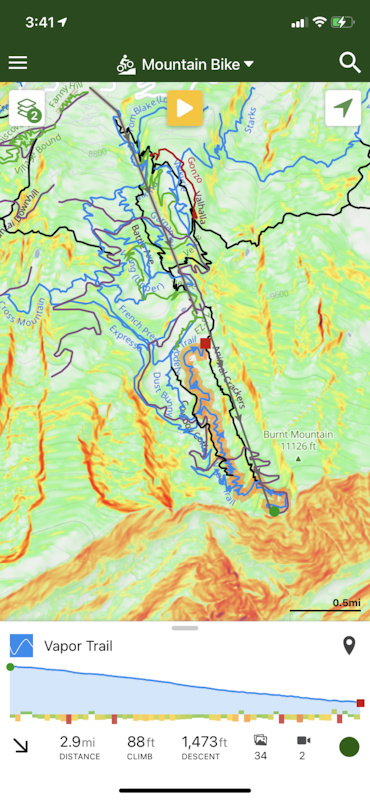
This layer provides a view of how steep and potentially rugged an area is. This is a great layer to use to find viewpoints or even scenic trails based upon their proximity to a steep ledge. It can also be used to determine not just how steep a trail may be, but for how long the trail will be steep. Will it be gradual and sustained, or will I climb up one short rocky wall and level off. The gradient uses an alarm style color gradient starting at green for relatively flat areas up through yellow, orange, and red to indicate increasing steepness. The very steepest areas like cliffs and extremely rugged terrain graduate the red towards black. So if you are looking for sheer cliffs, amazing vistas or that trail that takes you right long the ragged edge, you can see this in the app where trails take you out to the darkest shades.
From below the dark slope angle shading is often a good indication of great location to view cliffs, arches, mountains, and other terrain that many would deem picturesque.
Slope shading also provides emergency information when trying to find a way in our out of a canyon, where the darker shades are most often impassable.
How to View New Layers
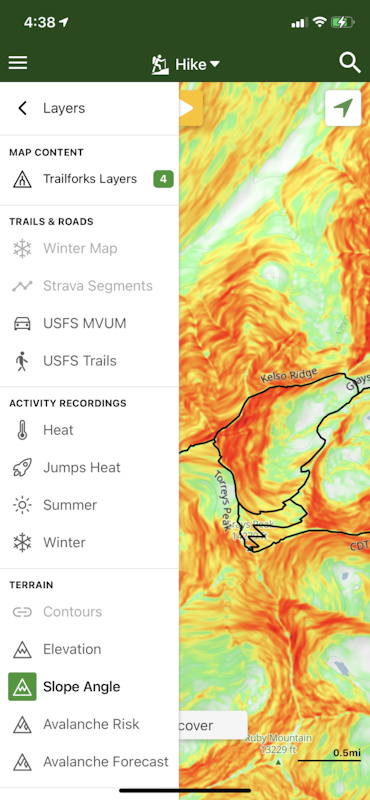
The Slope Angle and Elevation Color layers are easy to turn on and off withing the app. These layers are bright and visible within mountainous areas, and are easily seen in those areas once turned on. To view them tap the Map Settings button in the top left of the map to see options. From there, select the menu "Layers" to see available layers in the app. Here you can select any number of the layers available. Any layer turned on will highlight the icon in green to show what is selected.
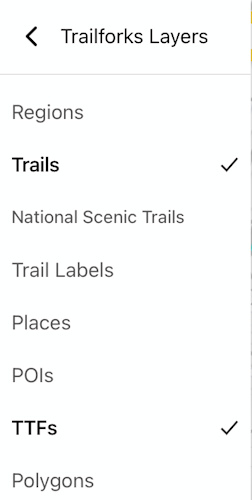
You may also notice at the top of the Layers Menu that there are "Trailforks Layers". This menu provides a way to customize all the little details on the map. Here you can turn off the Region Markers, and POIs you may not want blocking a view. This is a great place to customize your map and provide just the information you want to see.
![photo]()
You may also notice at the top of the Layers Menu that there are "Trailforks Layers". This menu provides a way to customize all the little details on the map. Here you can turn off the Region Markers, and POIs you may not want blocking a view. This is a great place to customize your map and provide just the information you want to see.
De-Emphasized Trail Style
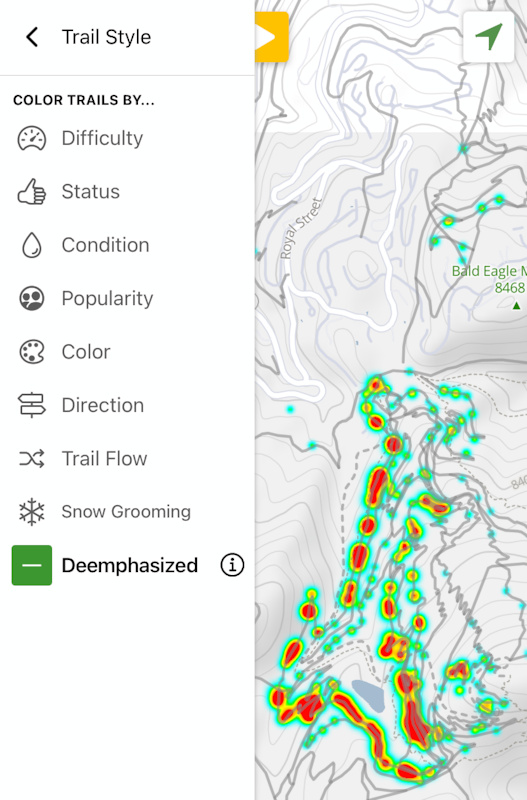
This latest release of Trailforks introduces several new Trail Styles. One of these styles we added to the app so that all these new layers can be more easily viewed. This style is called De-Emphasized. It paints all of the trails in a muted gray color. We found this style to be particularly helpful in areas where layers are not as bright or quickly seen. We especially like this style when viewing the new jump heatmap. The trails are colored gray, but all of their interactive ability has been retained. This way, when you see a big jump and you are interested in which trail it follows, you can still select the underlying trail.
Another way to De-emphasize the map and Emphasize the underlying layers to is to turn off other Trailforks Layers like POIs, Regions, or even Trail Name Labels to get a really clean view of the map.
Another way to De-emphasize the map and Emphasize the underlying layers to is to turn off other Trailforks Layers like POIs, Regions, or even Trail Name Labels to get a really clean view of the map.
Trailforks Pro is now part of Outside+, which means that you can get all the Trailforks member features, Trailforks PRO, Gaia GPS Premium, and much more for one price.
Author Info:

Must Read This Week
Sign Up for the Pinkbike Newsletter - All the Biggest, Most Interesting Stories in your Inbox
PB Newsletter Signup
But you are very much spot on in the rest of the points.